Discover SironaDX’s bioinformatics and digital image analysis services for spatial biology
The images generated from our spatial biology platforms contain a tremendous amount of visual data, and Sirona’s in-depth bioinformatic and digital image analysis service can complement them by generating quantitative information for a complete understanding of the samples.
Image processing and digital image analysis
In order to properly perform digital image analysis, a bioinformatic process is used to identify single cells and their cell types. While it may sound simple, there are many considerations to take into account, such as cell shape, overlapping cells, marker signal to noise ratio, positive versus negative signal, and manual gating versus clustering. With the employment of thoughtful bioinformatic pipelines on images from high-plex spatial imaging platforms, researchers can now analyze digital images to assess numerous markers on a single tissue section to identify various cell populations while conserving precious samples.
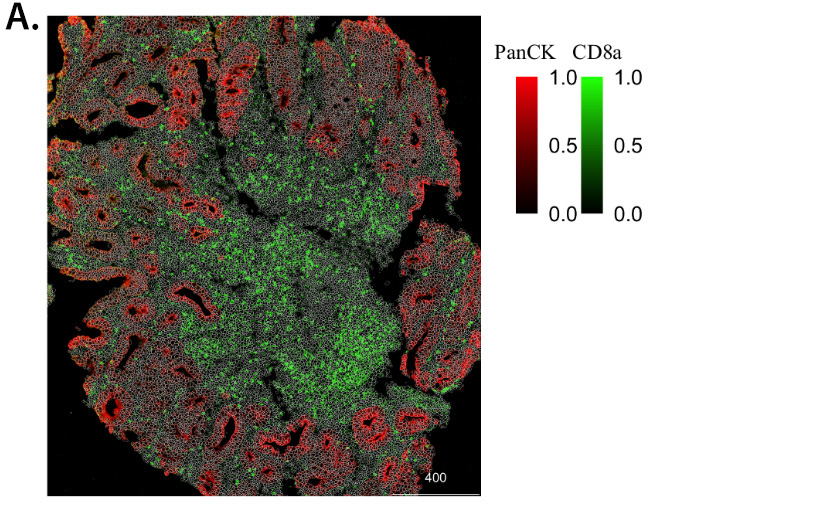
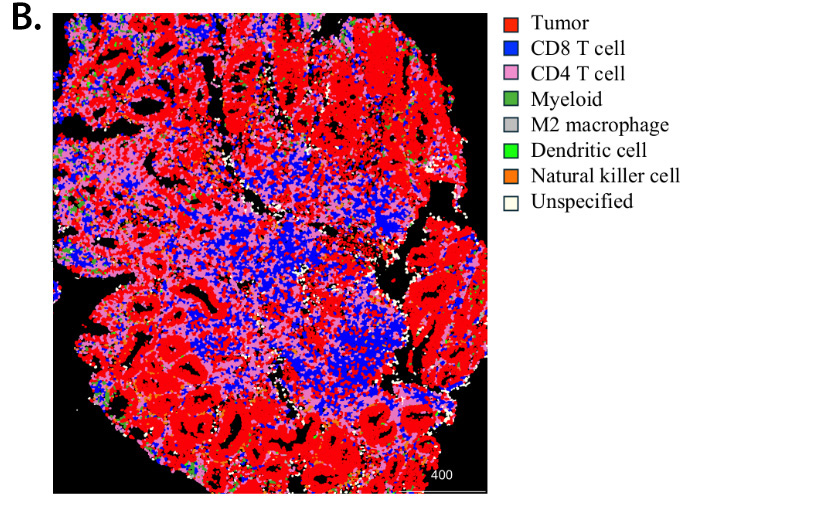
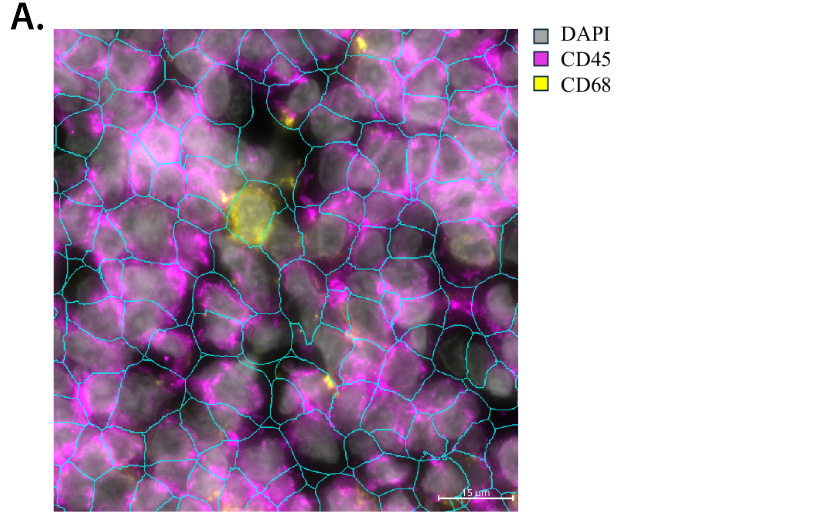
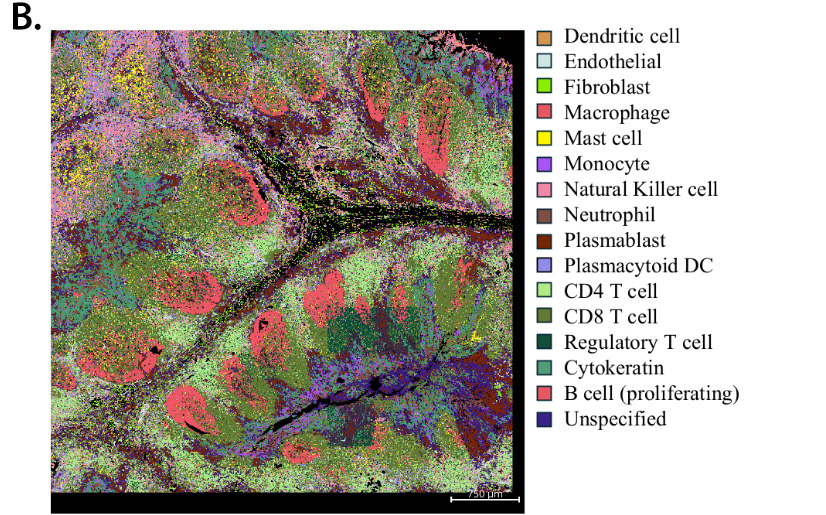
At Sirona, we have worked with numerous pharma companies to properly identify single cells (Figure 1A, 2A) and cell types from images generated on protein (Figure 1B) and transcriptomic-based (Figure 2B) platforms to answer scientific questions. In addition, the transcriptomic-based technology that Sirona employs, the NanoString CosMX, provides an opportunity to identify complex cell subsets, such as cancer associated fibroblasts and tumor associated macrophages, as well as different cell states from its wealth of markers, which can lead to generation of novel hypotheses and insights.
Figure 1. Digital image analysis identifies single cells and different cell types in CRC patient sample. CRC patient tissue section was stained with antibodies against tumor and immune markers, followed by imaging on the Hyperion IMC instrument. Digital image analysis was performed on the images to identify single cells with staining intensity of listed markers (A). Further image analysis identified tumor and immune cell populations (B).
Figure 2. Digital image analysis of tonsil tissue identifies single cells and different cell types derived from Nanostring CosMX transcriptomic data. Tonsil section was processed per manufacturer’s protocol for the 6K transcriptome panel and images were acquired on the Nanostring CosMX instrument. Digital analysis was performed on the image to identify single cells and listed markers (A), followed by identification of cell types listed in the key (B).
With the cell types appropriately identified, Sirona’s bioinformatic and digital image analysis service can further provide more advanced downstream quantitative assessments regarding cell population and spatial characteristics, as well as clinical relationships.
Cell Population Analysis
After cell identification, a typical readout, or biomarker, is the frequency of certain cell types within the tissue to understand the disease setting. This analysis can also be used to assess pharmacodynamic (PD) activity of therapeutics when pre- and post- treatment samples are available. Depending on the molecule and its mechanism of action, there may be increases or decreases in particular cell types. These changes in frequency can be further dissected to test subsets within different cell populations, in contrast to the entire tumor cellularity, to provide further understanding of PD activity.
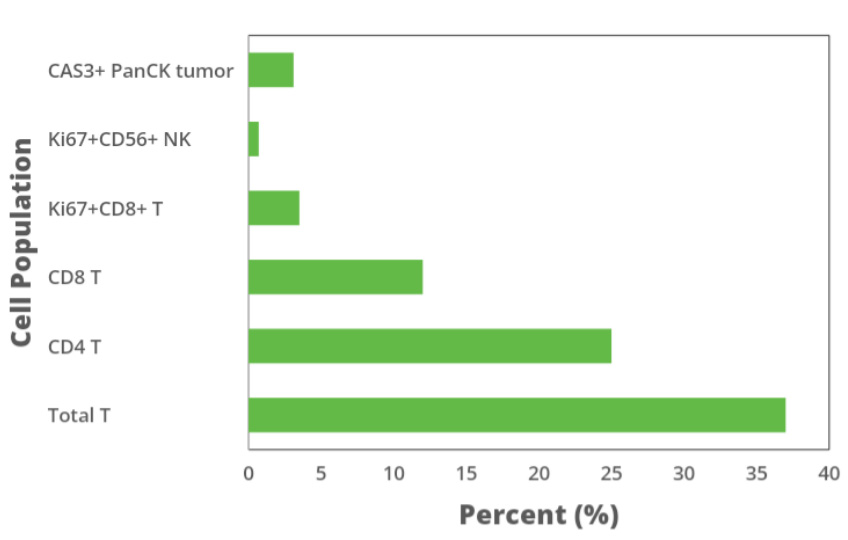
Sirona has partnered with numerous pharma clients to generate this type of biomarker analyses. The data includes cell subset frequency from a particular image (Figure 3) and/or other assessments that incorporate data from multiple time points to examine trends.
Another typical biomarker that is assessed on tissue sections is the expression level of certain protein markers, in particular tumor antigens. Here, studies have demonstrated that the expression level can predict the activity and efficacy of therapeutics. With the images generated from our platforms, the pixel intensity of markers can be determined to assess the expression level, which can be used to generate predictive biomarker hypotheses and/or observe pharmacodynamic changes depending on the samples.
Figure 3. Frequency of cell populations derived from downstream analysis of cell identification image from CRC patient sample. Downstream analysis of data from Figure 1B cell identification image quantitates the frequency of (top to bottom) CAS3+PanCK+ tumor cells, Ki67+CD56+ cells, Ki67+CD8+ cells, CD8 cells, CD4 cells, and total T cells in CRC patient tissue section.
Sirona has also collaborated with numerous clients to generate this expression level data. The analysis can be performed on a pre-treatment sample to assess baseline intensity or in combination with post-treatment samples to determine changes in expression level as a function of therapy.
Spatial (Neighborhood) Analysis
Besides the ability to assess population characteristics, downstream digital image analysis also provides the opportunity to assess spatial relationships (or neighborhood analysis) between different cell types and/or cells in certain regions, such as tumor and stromal areas, to better understand diseased settings.
In oncology, studies have shown that tumors can be classified based on where immune cells reside, which determines a patient’s survival and response to immunotherapy. Patients who have poor survival outcome and do not respond to IO therapy tend to have a “desert” state where very few T cells are found in the tumor. In contrast, patients who have longer survival rates or respond to therapy tend to be “inflamed” where there is a high infiltration of T cells in the tumor region. Additionally, studies have suggested that stromal cells may have a role in survival and IO response by excluding immune cells from cancer cells. Together, these observations further warrant investigation of the spatial relationship between these populations.
Currently, there are numerous therapies being developed that target cells who activate T cells and require close contact between them. With the imaging data and their subsequent proximity analysis, observations regarding the spatial distance between these cells and/or cells in certain regions in a diseased state can be made, and, also, how new therapies can affect and/or is affected by these relationships.
Clinical Relationship Analysis
With pre- and post-treatment clinical trial samples, data from the images, whether population and/or spatial characteristics, can be associated with response and outcome to assess potential clinical relationships. At Sirona, we have worked closely with our pharma partners to evaluate biomarker relationships with response. As shown, we have evaluated correlations between population frequency changes in responders and non-responders to determine which PD changes might foreshadow patient outcome. Furthermore, analysis can include predictive biomarker assessment in which biomarkers, such as expression level or population frequency in a certain region, on pre-treatment samples can be correlated with response. By identifying these correlations, clinical trial designs can be refined and honed to focus on relevant biomarkers, which may progress into companion diagnostic development.
At Sirona, we are one of the very few companies who offer end-to-end spatial biology services, from panel design to image acquisition to in-depth digital image analysis, in order to generate the most impactful data, results, and insights.

